Waveform Accuracy under IEC 61869
The new IEC 61869 now defines the sampling rate for CT and VT sensors as either 4.8 kHz for general protection applications or 14.4 kHz for power quality type measurements.
Clearly this means sampling every 0.208333 milliseconds and 0.069444 milliseconds respectively.
This means that the interim UCA IUG Guideline known as IEC 61850‑9‑2LE is defunct – no longer needed.
In any case it was not a Standard as such, but just an interim “gentleman’s agreement” of sorts to give some basis of all vendors having interoperable devices – there was no mandatory compliance requirement and some of its specification was out of date, not really practical and in fact not quite good enough from a performance aspect anyway such as “1PPS over glass fibre”.
IEC 61850‑9‑2 Sampled Values applies to all the 20+ T-group sensors (T Group - analogue samples (22)) - of which only two relate to CT and VT sensors (Logical Nodes TCTR and TVTR).
IEC 61850‑9‑2LE and now IEC 61869-9 "simply" provide the parameters associated with configuring the Merging Unit's generic Multicast Sampled Value Control Blocks "MSVCBxx" to suit CT and VT applications (you could for instance use TCTR to provide sampled values of the battery d/c/ current once every hour but those parameters would not suit CT and VT applications).
However have you ever wondered what the difference in sampling rates really means in accuracy?
Well, "accuracy" is probably not the right word as that has many aspects, but rather correlation or discrepancy between the known samples (which as a number may be highly accurate at that instant) to the continuous waveform itself between the samples.
When an IED is sampling, it only knows the value of the waveform at the last sample. There is a step-change in "known value" every time a new sample is taken. Obvious really.
that means the IED must take samples sufficiently frequently to satisfy the performance requirements and accuracy requirements of the function itself.
Of course using faster sampling is no problem for the function as it can "pick and choose" which ones it uses - it can even "re-sample" a derived waveform at a different sampling rate.
However using unnecessarily faster sampling increases the bandwidth requirements which puts additional performance requirements on the IED port itself as well as the LAN bandwidth capabilities to distribute all messages with the required latency.
Those issues are not new as we have long used protection class CT/VT to derive measurements of Amps, Volts, Power, Frequency even when the current was less than 10% of rated where the CTs are working in their ankle point, or that even at their accuracy limit factor they are only 5 or 10% accurate. But measurement of those quantities associated with Revenue Metering for billing purposes needed to be far more accurate so much higher accuracy CTs were needed as well as higher accuracy metering devices. In the old days of electromechanical "disc" meters, there was no sampling and the accuracy was purely based on the physical construction of the meter.
So how much more "accurate" is a sampling rate of 14400 Hz that is three times 4800 Hz?.
This is much like the question of the impact of different GOOSE repetition rates and whether the network is flooded when an event occurs
For most instances it is inherently obvious but sometimes it is nice to know the "mathematics" behind it - e.g. GOOSE "Flooding" .
Of course there is the accuracy of the actual sampling process - i.e. if the value is "102.7612 A", does the digital sample show that as precisely that within a small percentage e.g. ±0.5% would give up to "103.2750" or as low as "102.2474".
That is clearly dependant on the vendor's design of the CT/VT sensor (wire-wound or optical) and the Merging Unit's hardware, just like the old CT and VT and the electromechanical meters.
But when it comes to sampling frequency, it is a question of how close the samples represent the actual waveform - we know that sampling at 100 Hz will just give the IED two samples per cycle so it won't know what the waveform really looks like.
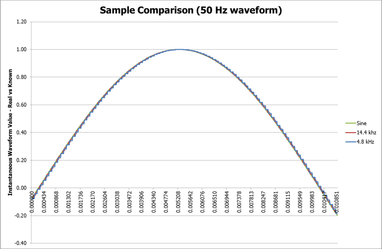
If we compare the actual sine wave to the known value determined by the IED, we can see the effect of the different rates of step changes in calculated values as shown in this 10.9 milliseconds of a 50 Hz cycle below (a little more than half a cycle):
The green line is the actual sine wave, whilst the red and blue lines are the values determined by the IED (assuming perfect A/D conversion).
The image shows the result of the the start of 1-second sampling window (the sample number resets to zero at the start of every 1-second window) being independent of power system waveform as of course the power system itself is not "synchronised" to real time.
As the waveform nears the peak, the rate of change of the waveform of course becomes less, and hence the difference becomes much smaller, i.e. the accuracy to the real waveform of both sampling rates is much closer to be virtually imperceptible at the peaks, but near the zero crossings the difference is evident.
In the first quarter cycle of a waveform with the waveform increasing, the known value between samples is less than the real waveform, whilst the in the second quarter, the relay retains a value higher than the waveform.
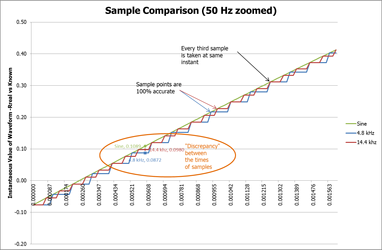
The difference is only just evident on the above image scale, but if we zoom in on the first few milliseconds, the difference is more visible:
Naturally the samples individually are 100% accurate, 0% error when the samples are taken.
However between samples, the known value deviates from the real value. If the two different sampling rates were totally independent, i.e. the clocks controlling the sampling were totally independent, the two samples sequences would never agree. However because Merging Units are all time synchronised (by IEEE 1588 v2 Precision Time Protocol signals being distributed by IEEE 1588 v2 PTP network switches and IEDs) to start their 1-second measuring window at exactly the same instant (within one microsecond coherency), the two sample sequences will align together every third sample of the 14.4 kHz series.
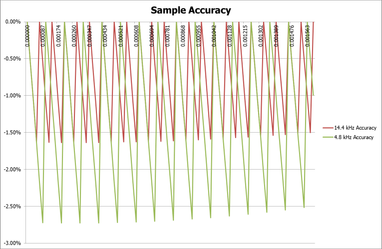
We can now determine what this means as accuracy of the measurement compared to the real measurement, i..e the value known by the IED compared to the real value at times in between the samples. Obviously the sample itself is accurate (apart from measurement and signal processing), but in between the time of actual samples, small errors occur. Of course this has been the case ever since devices changed form electro-mechanical flux based devices to devices using sampling techniques.
Interestingly we see that the 4.8 kHz sampling has a maxim error of some 2.72% at the early part of the cycle, whilst 14.4 kHz (three times the sampling rate) has a maximum error of just over 1.63% - i.e. the error has reduced to 60% of the error of the slower sampling rate.


