From time to time I hear of discussions about why our electrical power systems are 3 phase? - Why not 2-phase?
- Why not 4-phase?
Obviously 3-phase uses fewer conductors than 4‑phase, but more than 2‑phase. - Is it purely an economic compromise?
- Is it some apparent argument of the “electrical gurus” of yester‑year where one "happened" to win and one lose?
This analysis provides some “obvious” maths to dispel the myths and misunderstandings. Single-PhaseStarting with the obvious, lets assume we have a single phase power system at 50 Hz (the frequency does not matter to this analysis, but gives the time scale of one cycle at 20 milliseconds). For this article, we can assume no harmonics, transients, decrements, inrush etc simply because we are talking about the "steady state" principles of how many phases we should use to build the power infrastructure. Therefore we know the A-phase voltage is an alternating sinewave, in this example with a peak scale value of "2" (i.e.1.414 r.m.s.) with plus and minus half cycles as shown here (large dashes, but continuous). 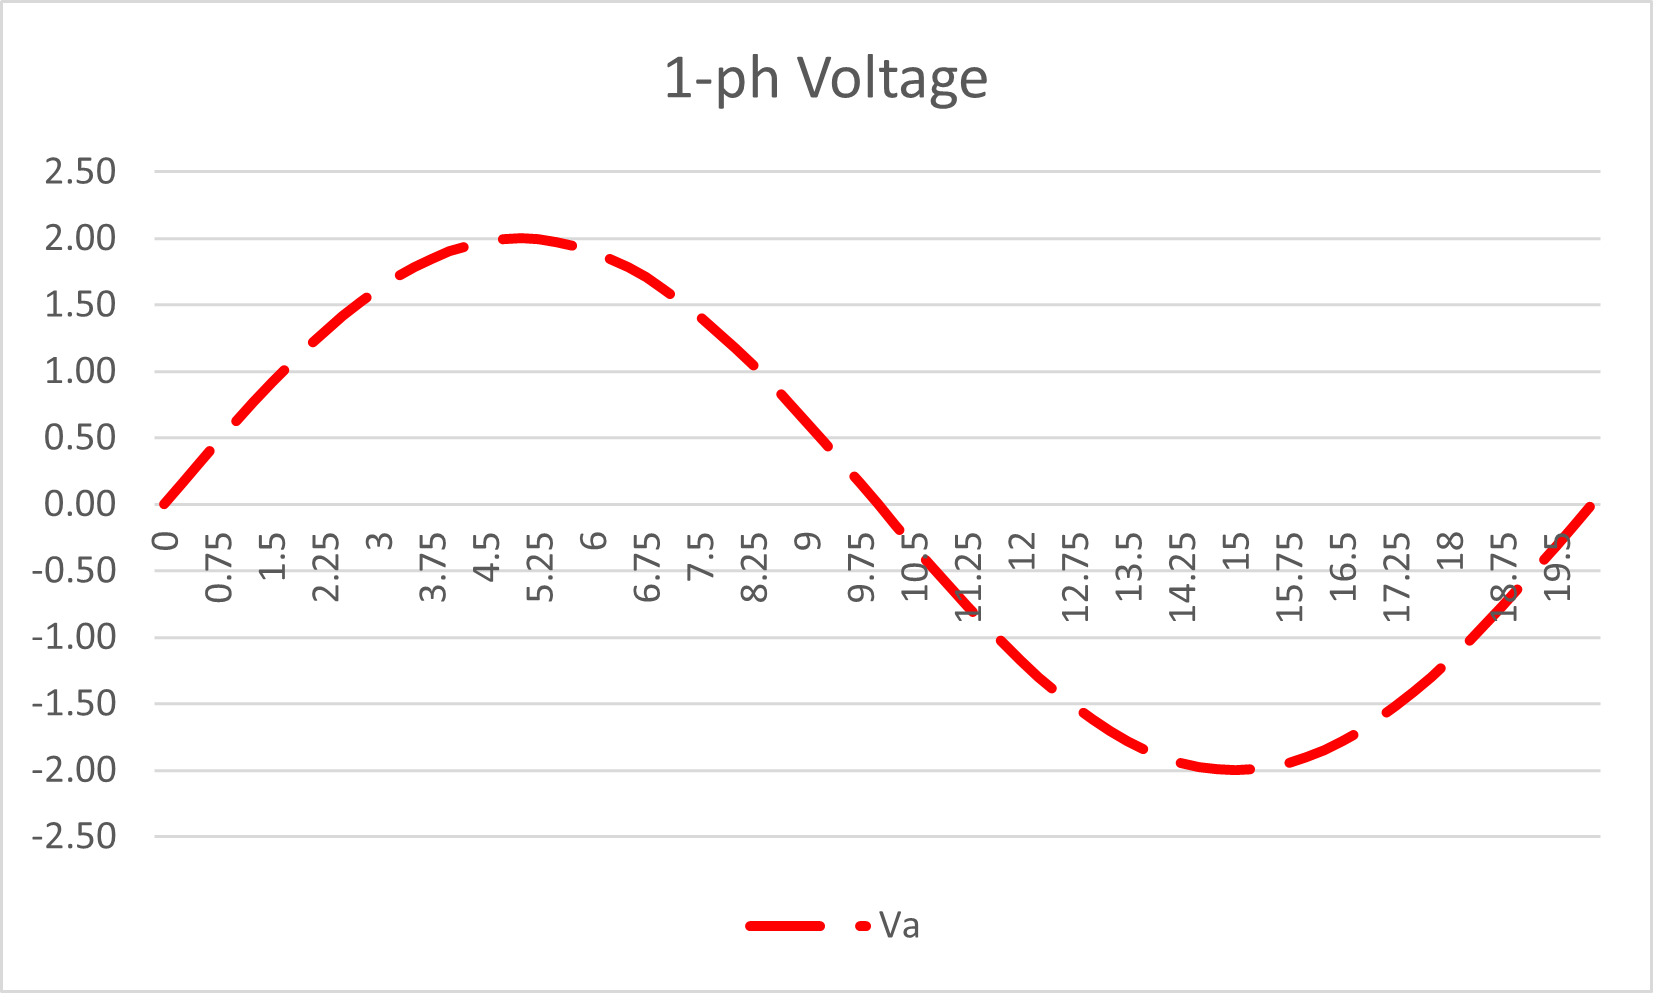 Figure 1: Single-phase system: Alternating Voltage Waveform Figure 1: Single-phase system: Alternating Voltage Waveform
To remain "representative" of a real power system, I will assume there is a 0.98 Lagging Power Factor load, i.e. current lags the voltage by 10°.
It is of course a couple of clicks to see the difference for unity power factor, or any other lead/lag power factor, and of course you can create your own spreadsheet to play with.
However we just want to focus on the principles. The current is also an alternating sine wave as shown here (small dashes). 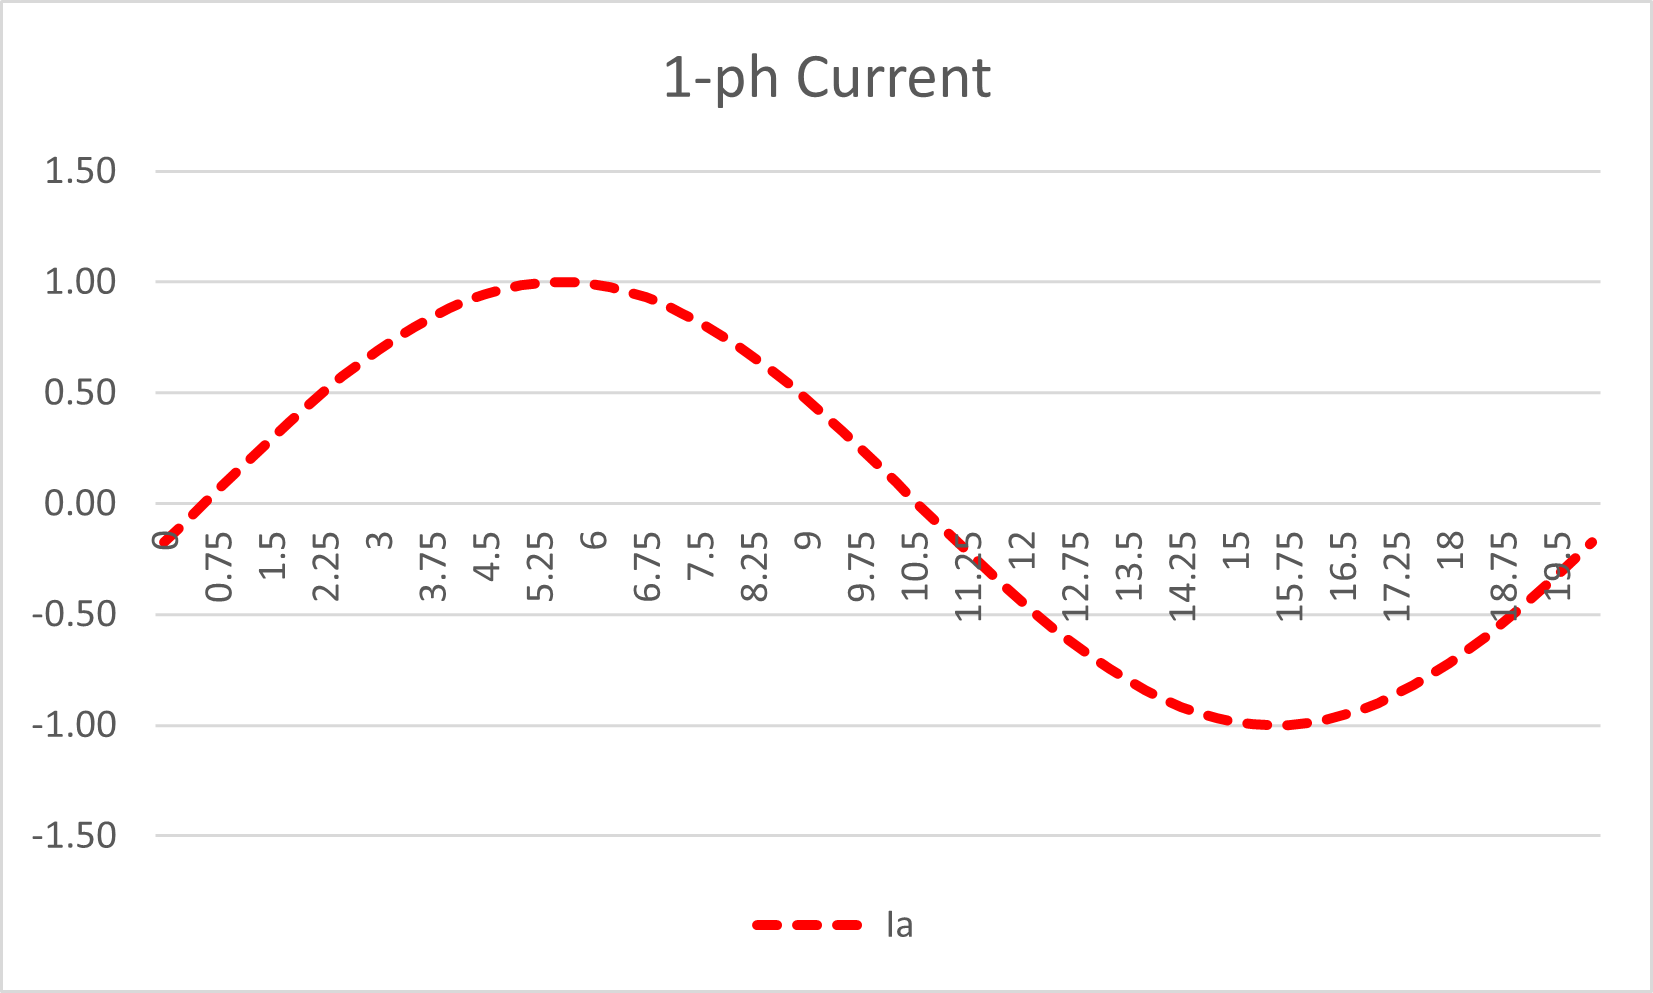 Figure 2: Single-phase system: Alternating Current Waveform Figure 2: Single-phase system: Alternating Current Waveform
On a phase-by-phase basis, Apparent Power is defined as S = V x I This of course can be done using the r.m.s. values, however it is necessary for this analysis to do it on a sample-by-basis through the full cycle of the waveform. Multiplying the voltage and current instantaneous values provides us with the alternating waveform of Apparent Power. 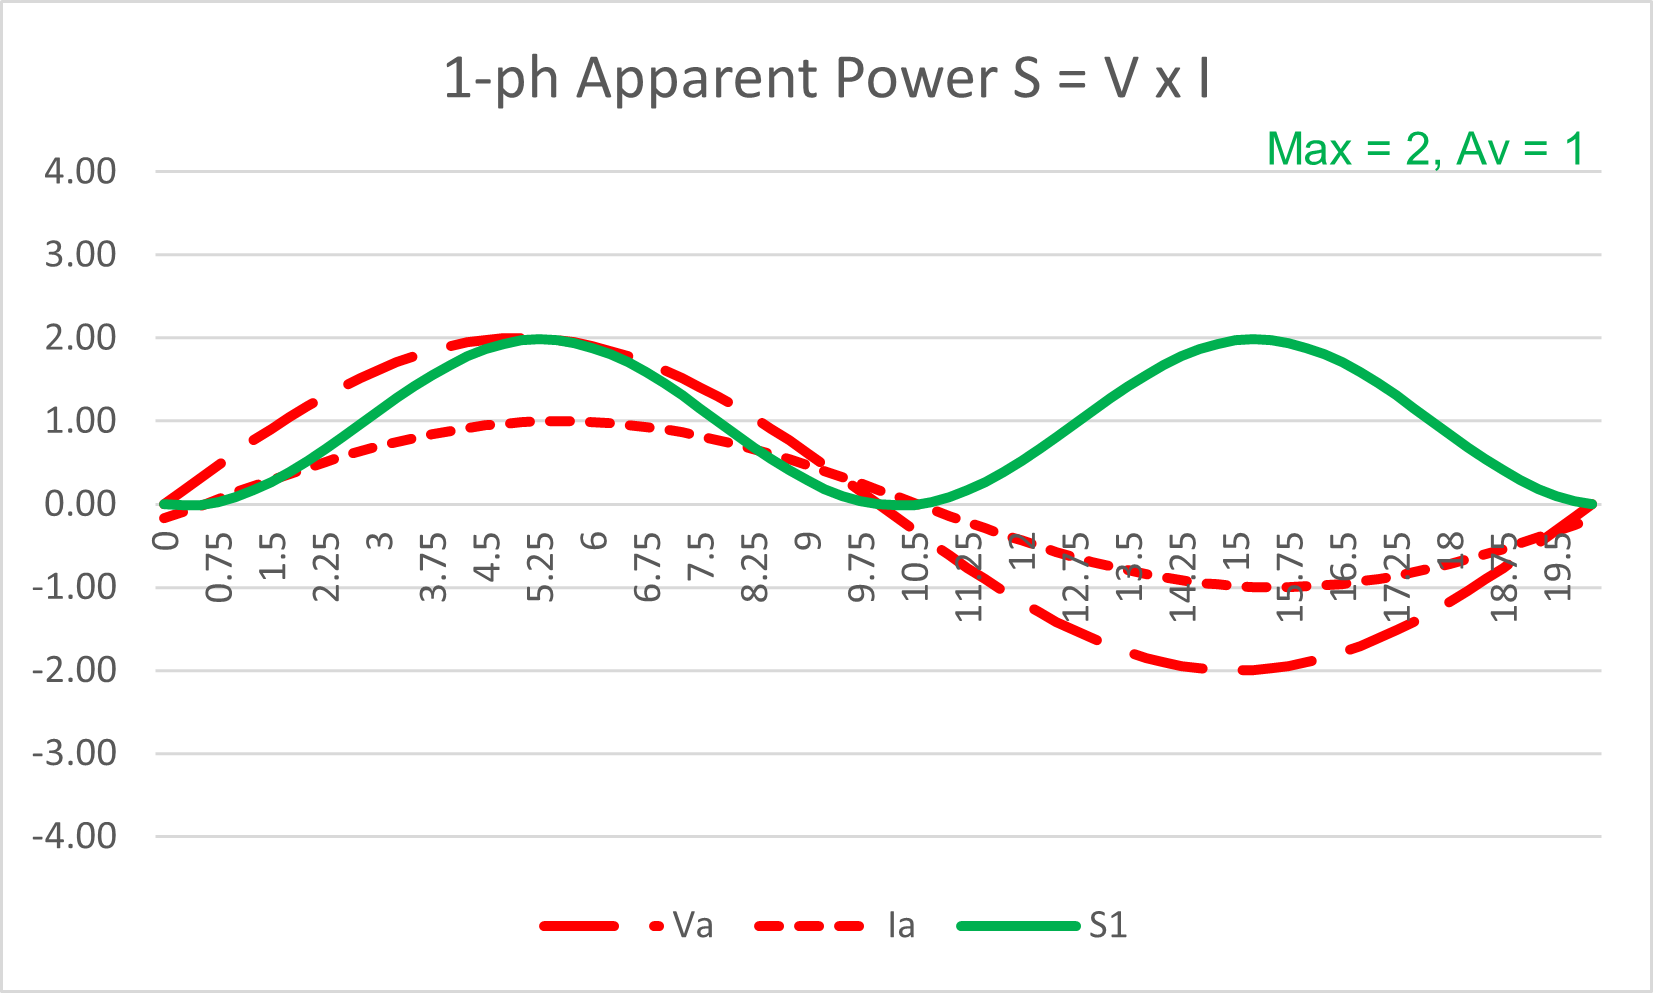 Figure 3: Single-phase system: Apparent Power Waveform Figure 3: Single-phase system: Apparent Power Waveform
We can clearly see that the Power waveform is effectively all positive ... apart form a short period when, due to the power factor, one is positive and the other negative. But clearly two negatives multiplied together make a positive. Hence the Apparent Power is an alternating waveform mostly all positive in each half cycle, i.e. it varies from zero to a maximum at twice the system frequency. The maximum instantaneous power transfer is “2”, but the average is ”1” Obviously the power transfer is not constant. Another way of looking at that power transfer variation throughout thecycle the cycle is in terms of "watt.hours", i.e. integrating the power transferred instant-by-instant. 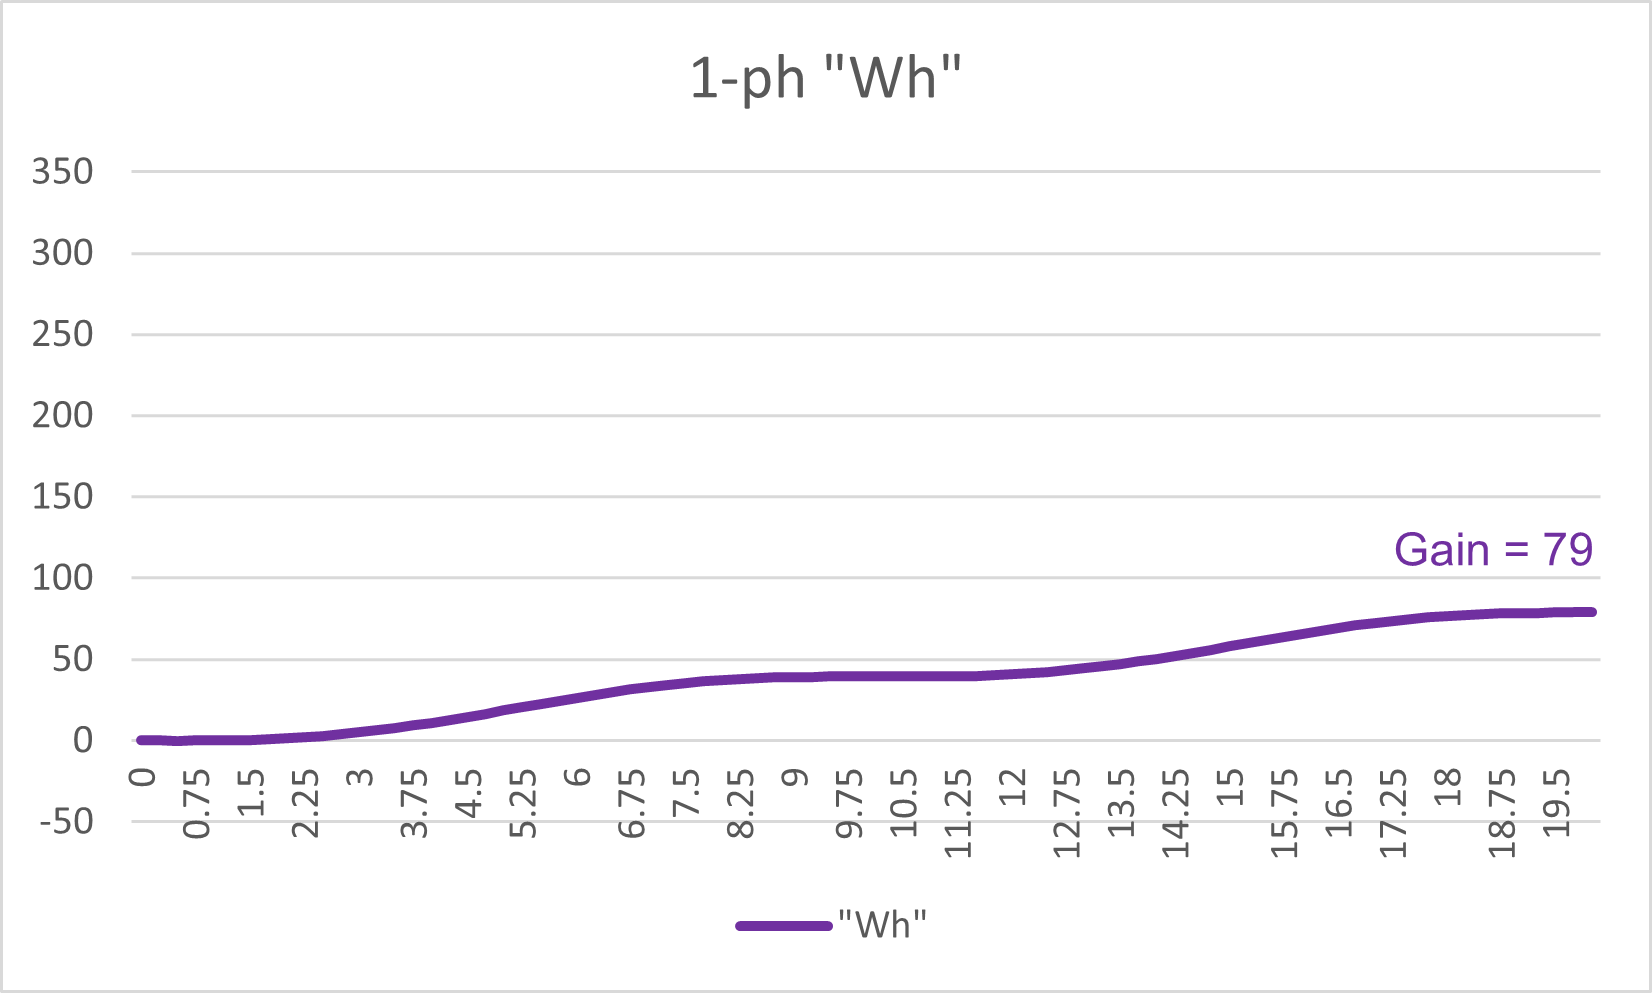 Figure 4: Single-phase system: Cumulative Power Transfer Figure 4: Single-phase system: Cumulative Power Transfer
We can see that the "Wh" graph is "low" at the start, reaches a maximum transfer rate, plateaus, then increases again, then plateaus.
But if you are "burning coal" to produce the power, the rate of coal burn during that 20 ms does not change . Two .. I know that is a "long bow to draw" between the electrical power delivered vs the fuel energy, but I hope you get my drift . Two-phaseWe can introduce an extra phase to make a two-phase system. The voltages will be 180° opposite each other. it is something like the pedals on a bicycle. One side at the top, the other side at the bottom in perfect opposite direction. 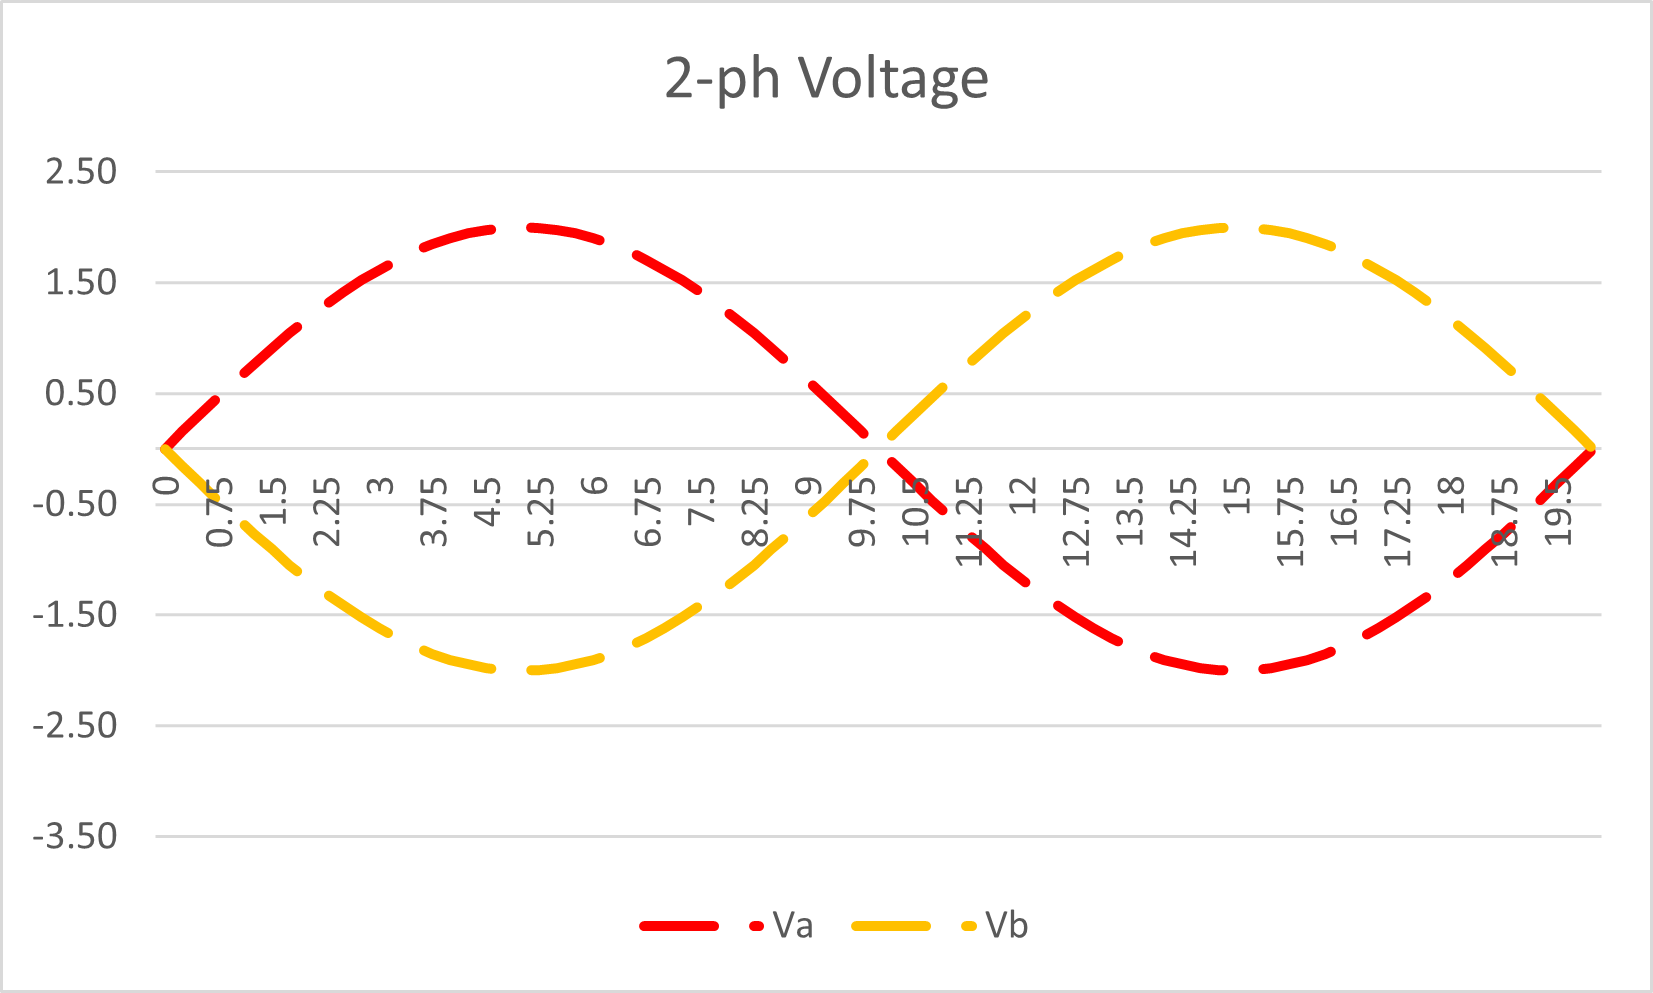 Figure 5: Two-phase system: Alternating Voltage Waveform Figure 5: Two-phase system: Alternating Voltage Waveform
If we retain the same power factor, the second current will also be 180° opposite.
If that was the case, when we overlay the power waveforms we could not see the two phase colours so I have cheated a little bit here. Instead of the same 10° lagging of the A phase, I have made the B phase current lag the B phase voltage by 13° just to slightly segregate the waveforms on the chart for clarity, i.e. the red and yellow Power waveforms don’t lie exactly on top of each other as they should for the same phase angle. 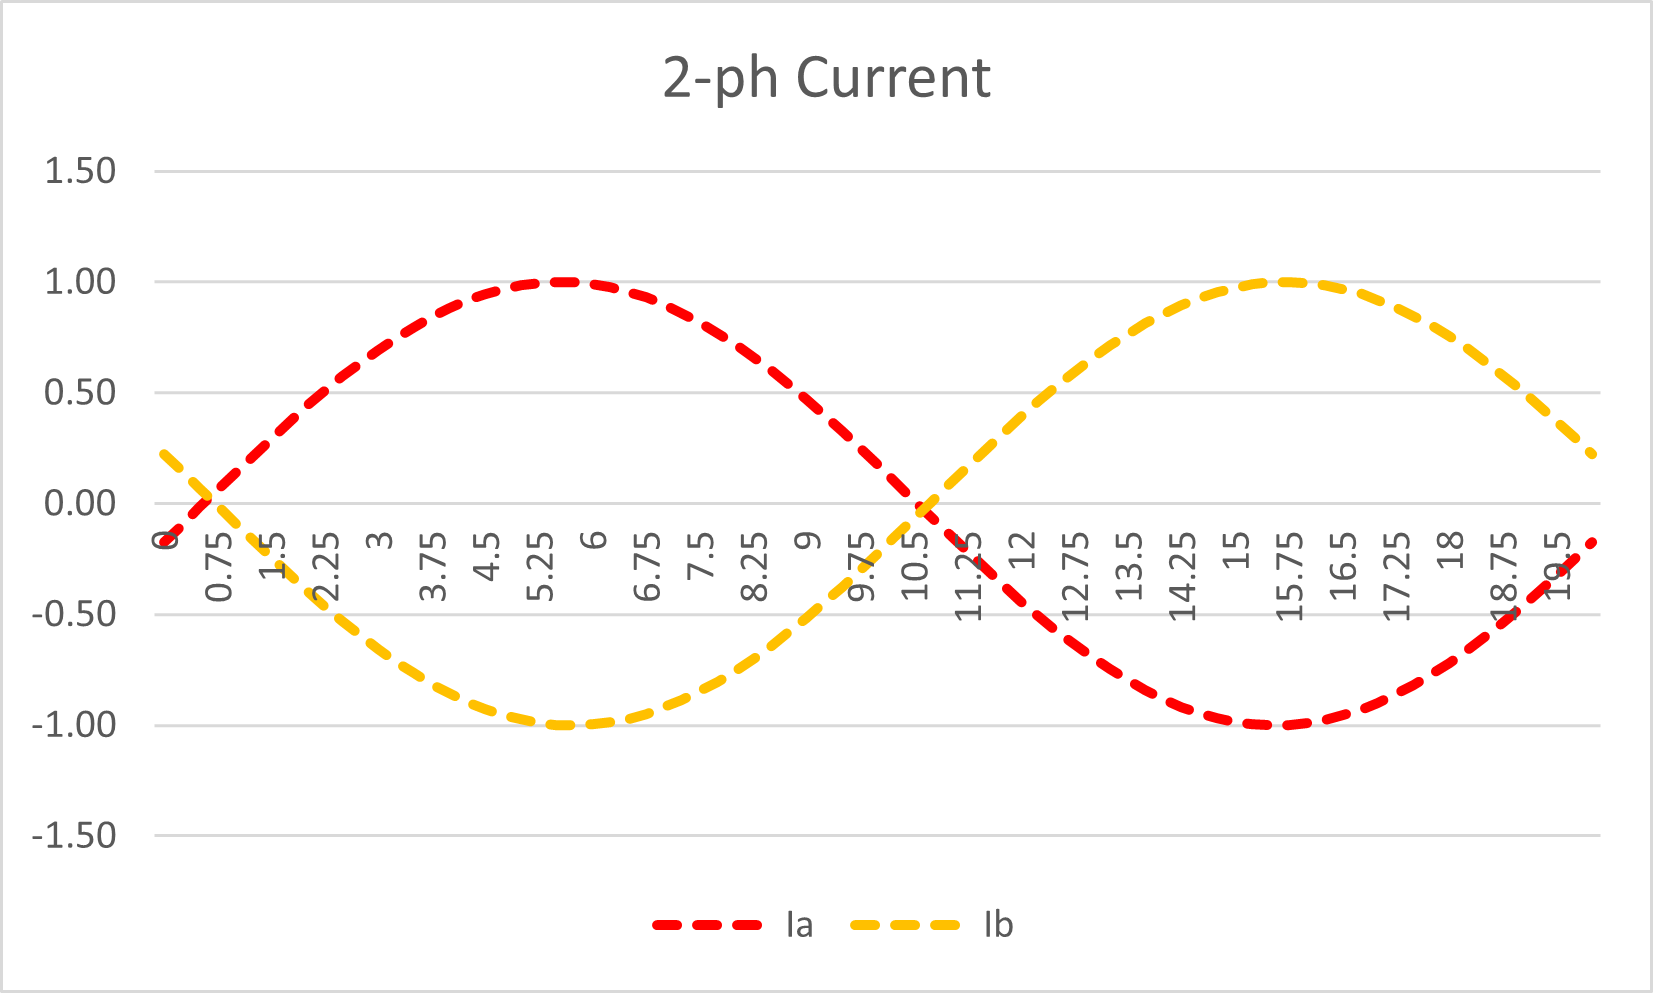 Figure 6: Two-phase system: Alternating Current Waveform Figure 6: Two-phase system: Alternating Current Waveform
If we now do the power calculations per phase, and then add them to obtain the TOTAL power “S2”, we now have the benefit of twice the power transfer at any instant .. as you’d expect.
Note you can just see the red A phase behind the yellow B phase because of my "cheat" mentioned above .. as you can see the cheat error is not significant for the purposes of this article. 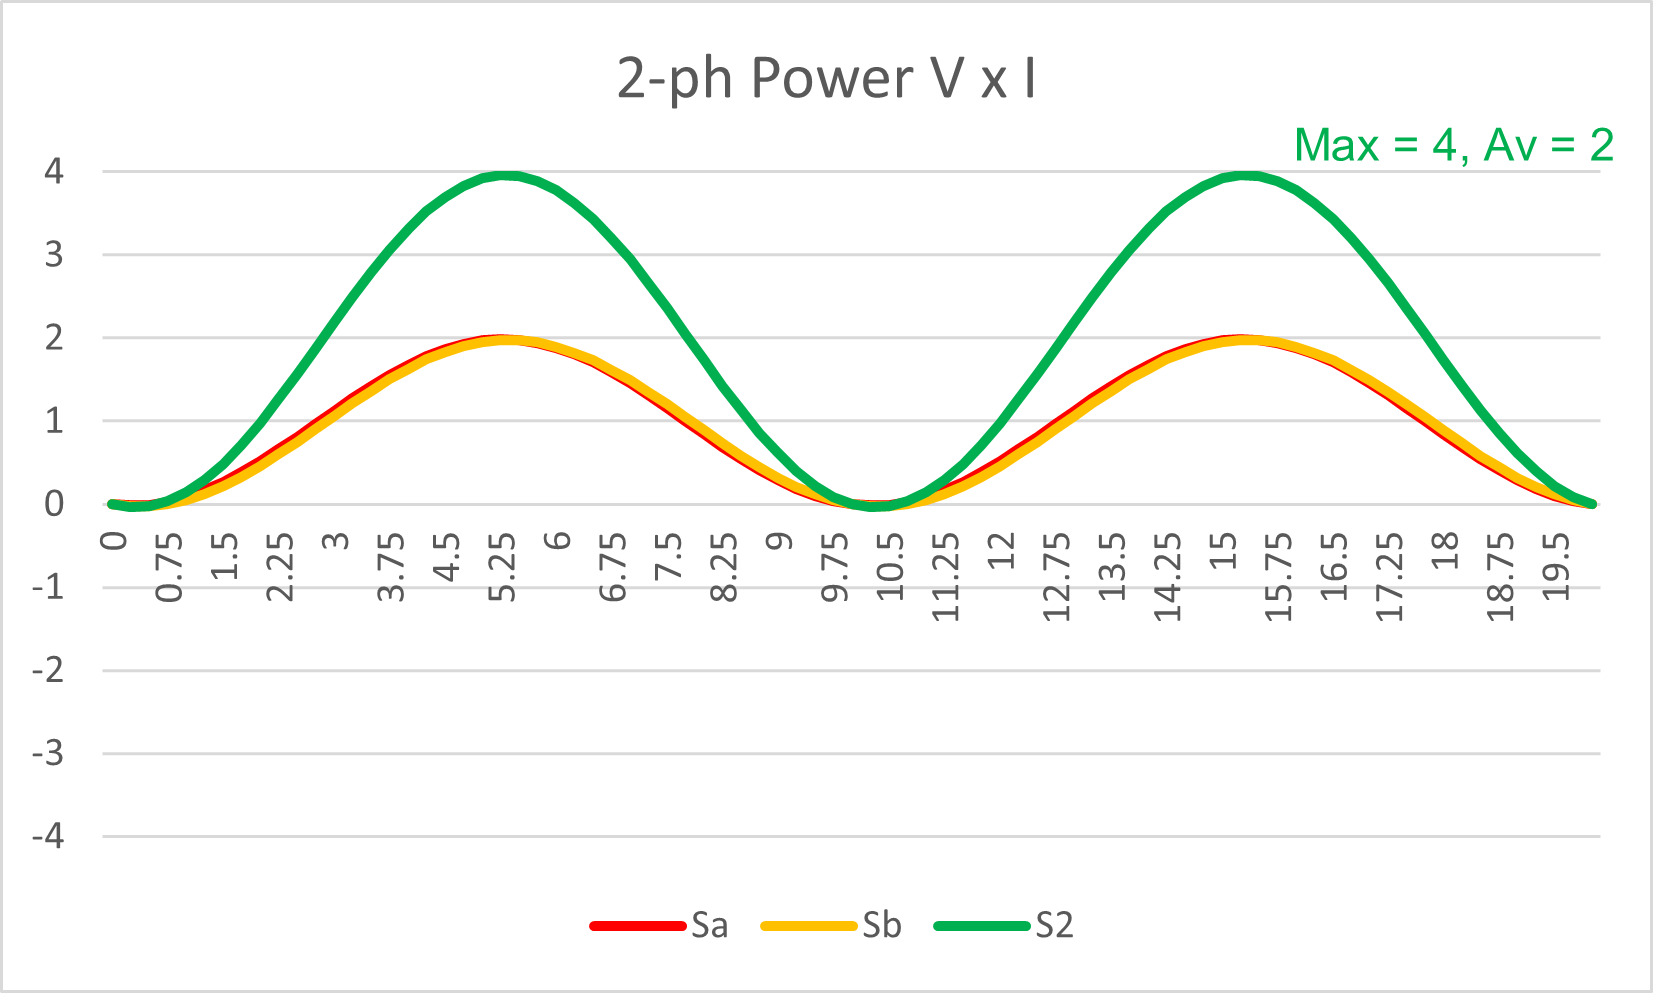 Figure 7: Two-phase system: Apparent Power Waveform Figure 7: Two-phase system: Apparent Power Waveform
The maximum power is “4”, but the average is “2” However it still remains a sinewave power transfer from zero to the maximum at twice system frequency. Overall we have doubled the power transfer compared to just using a single-phase system. We can relate this to riding a bicycle ... one foot provides the power transfer on the push‑down, then the other in the next half revolution. However Power is still not constant. Again we can consider the watt.hour integration:  Figure 8: Two-phase system: Cumulative Power Transfer Figure 8: Two-phase system: Cumulative Power Transfer
We have certainly doubled thee watt.hours simply because we have two wires carrying the power, but we still have this the same plateau effect. Three-phaseWe can now introduce the third phase to make a three phase system, with the voltages precisely 120° apart .. as we use everywhere .. so that is a clue that maybe there is a good reason to do so! 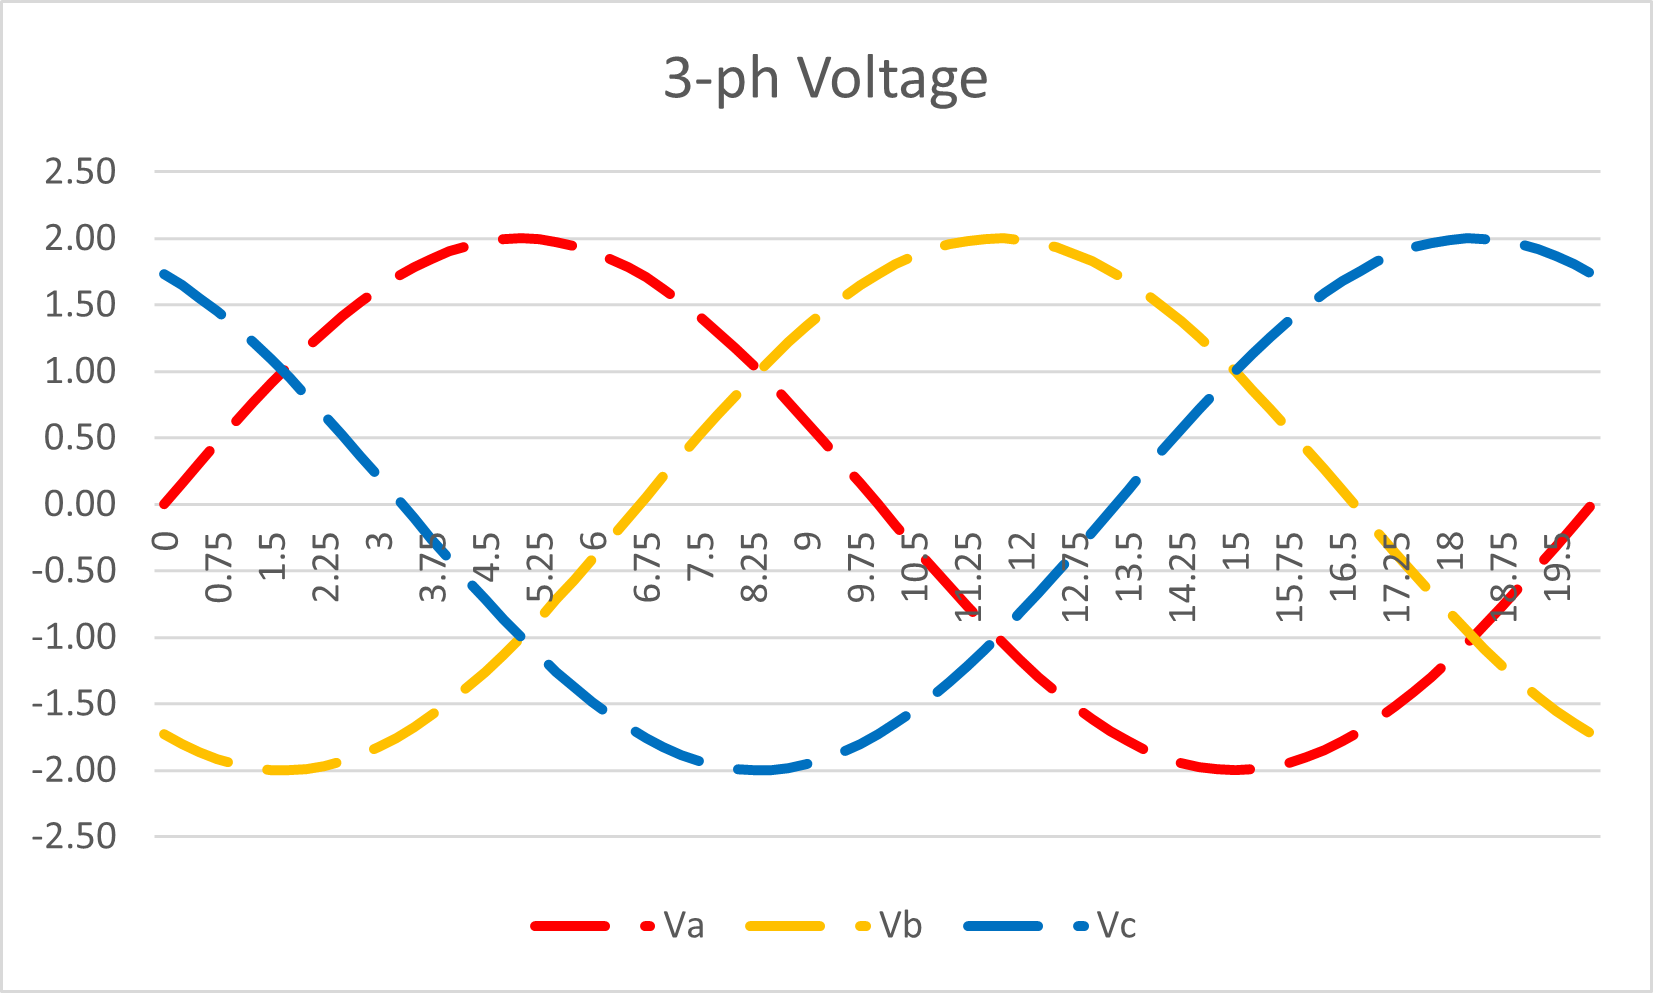 Figure 9 : Three-phase system: Alternating Voltage Waveform Figure 9 : Three-phase system: Alternating Voltage Waveform
We can revert to the same 10° phase angle across all three phases as they don’t lie on top of each other. 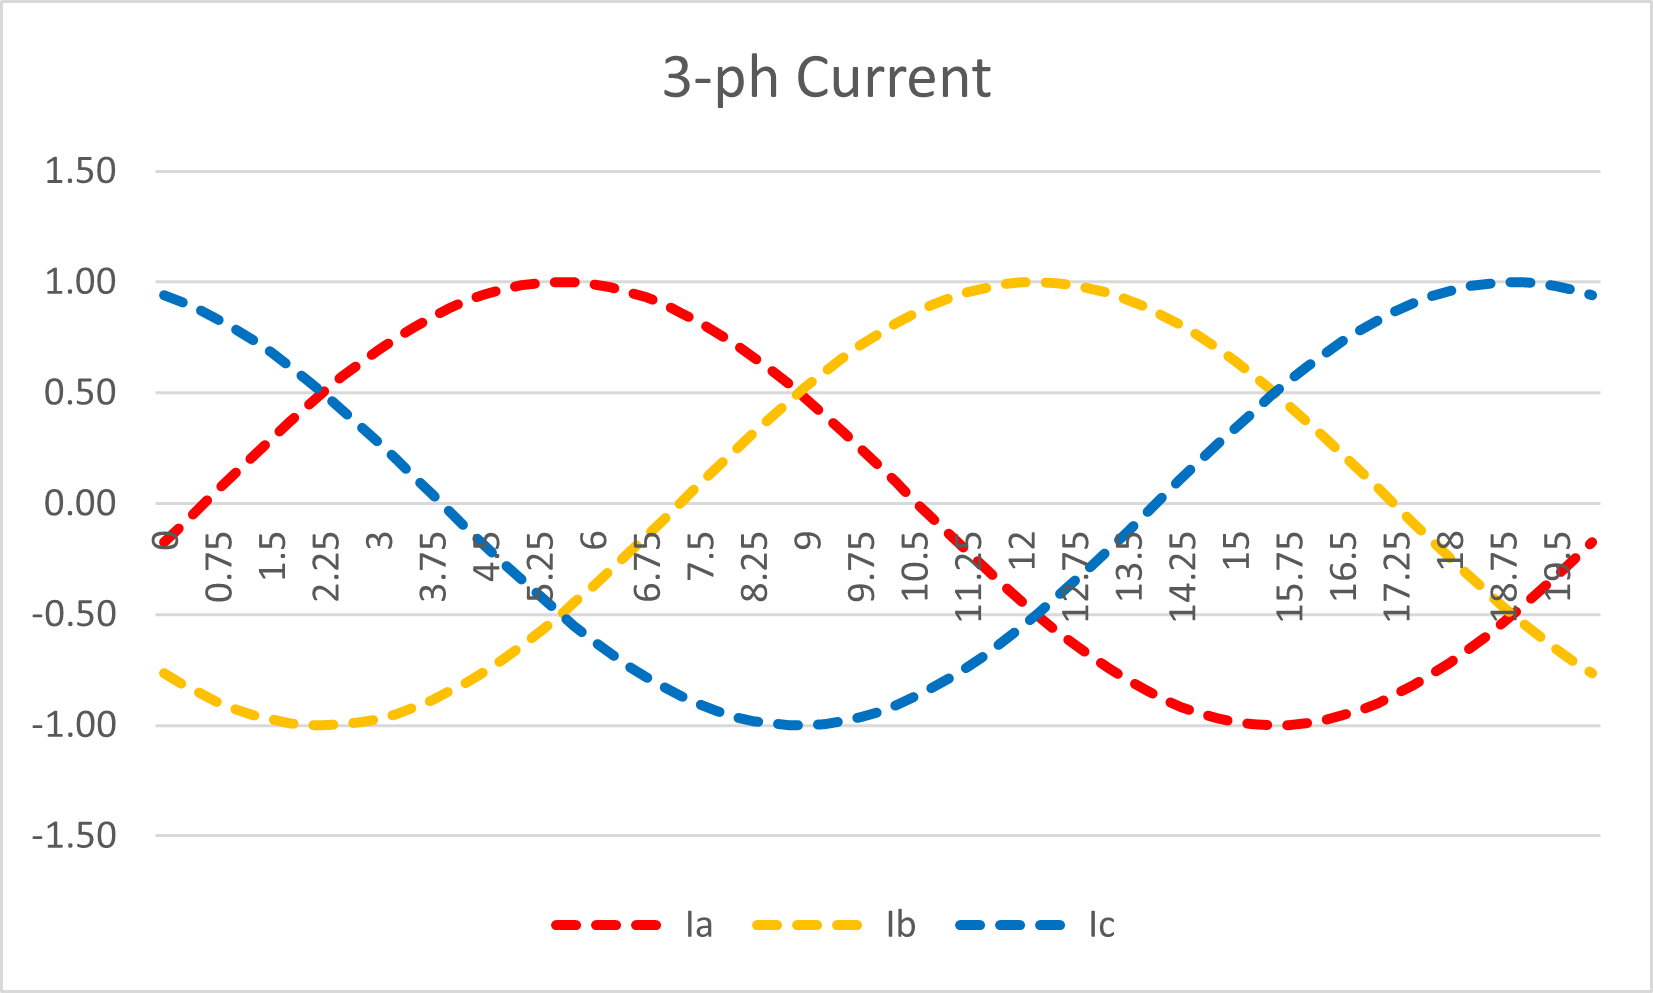 Figure 10: Three-phase system: Alternating Current Waveform Figure 10: Three-phase system: Alternating Current Waveform
If we now do the power calculations, we get the three individual power transfers at 120° separation. 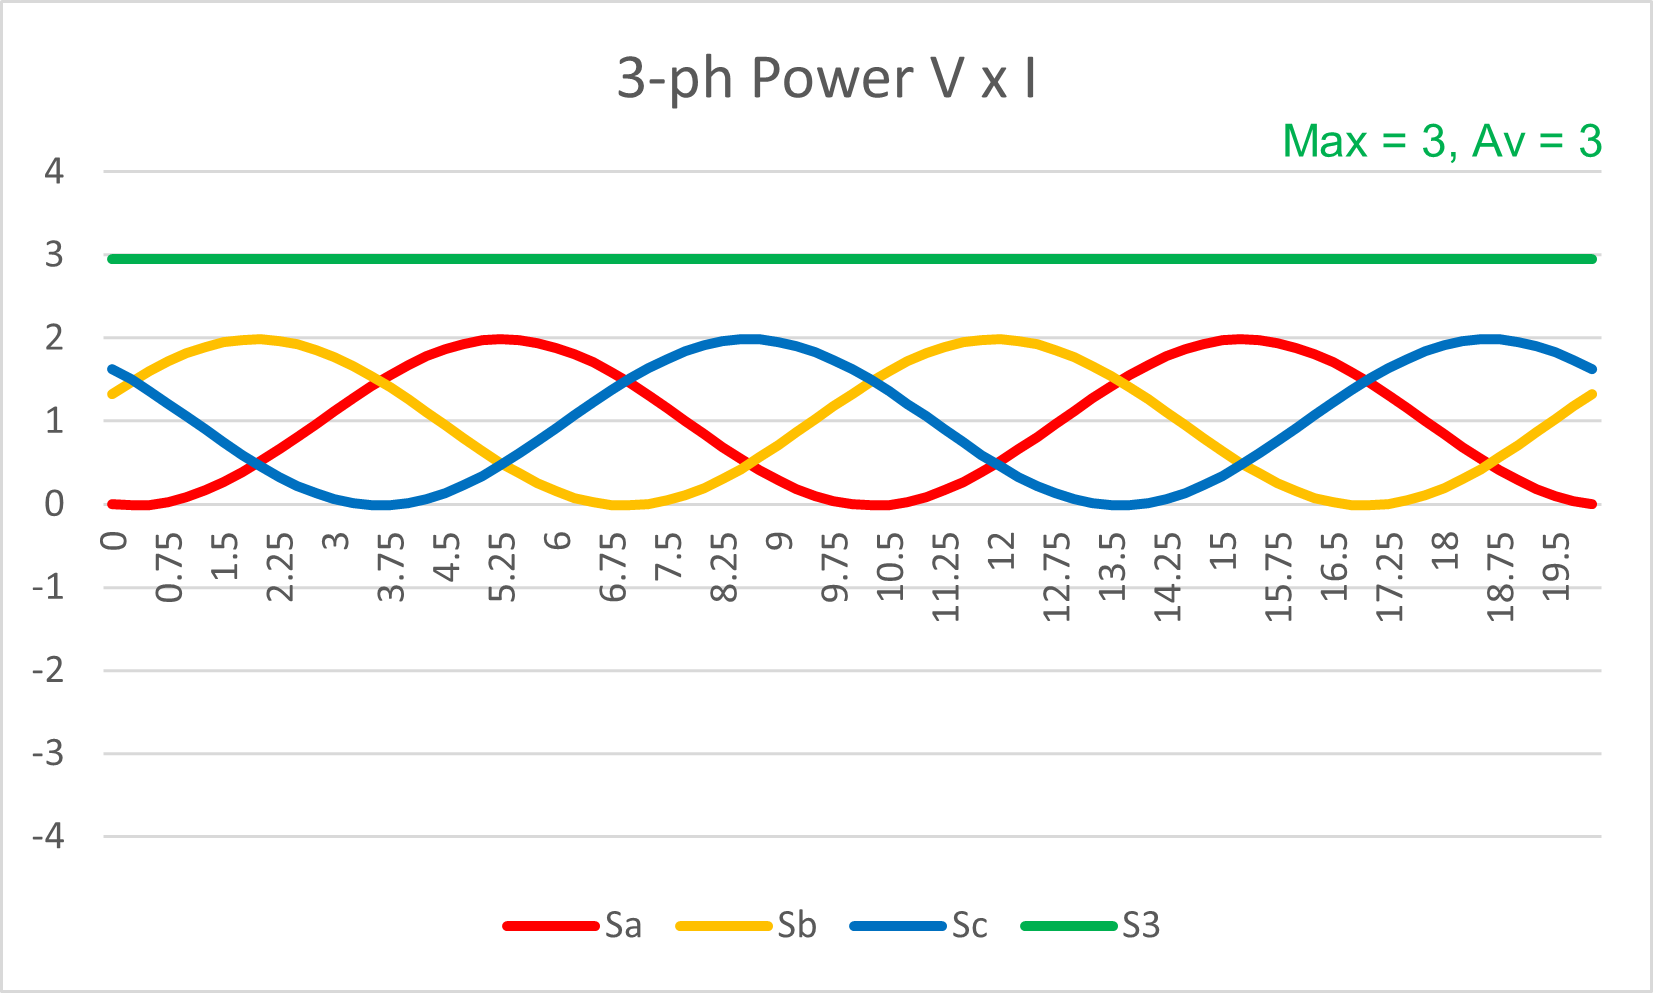 Figure 11: Three-phase system: Apparent Power Waveform Figure 11: Three-phase system: Apparent Power Waveform
The maximum on any phase is “2”, with an average of “1”. But the amazing thing is that the TOTAL power is now a flat line.
Maximum 3, Average 3 We no longer have the alternating power transfer.
No more "bicycle pedapedal" l variations from one instant to the next! CONSTANT POWER TRANSFER The 120° separation means that the waveforms constantly "adjust" to compensate for the other two phases. Maximum of “3” and an average of “3”.So the integrated energy transfer is now a straight line .. no plateau! 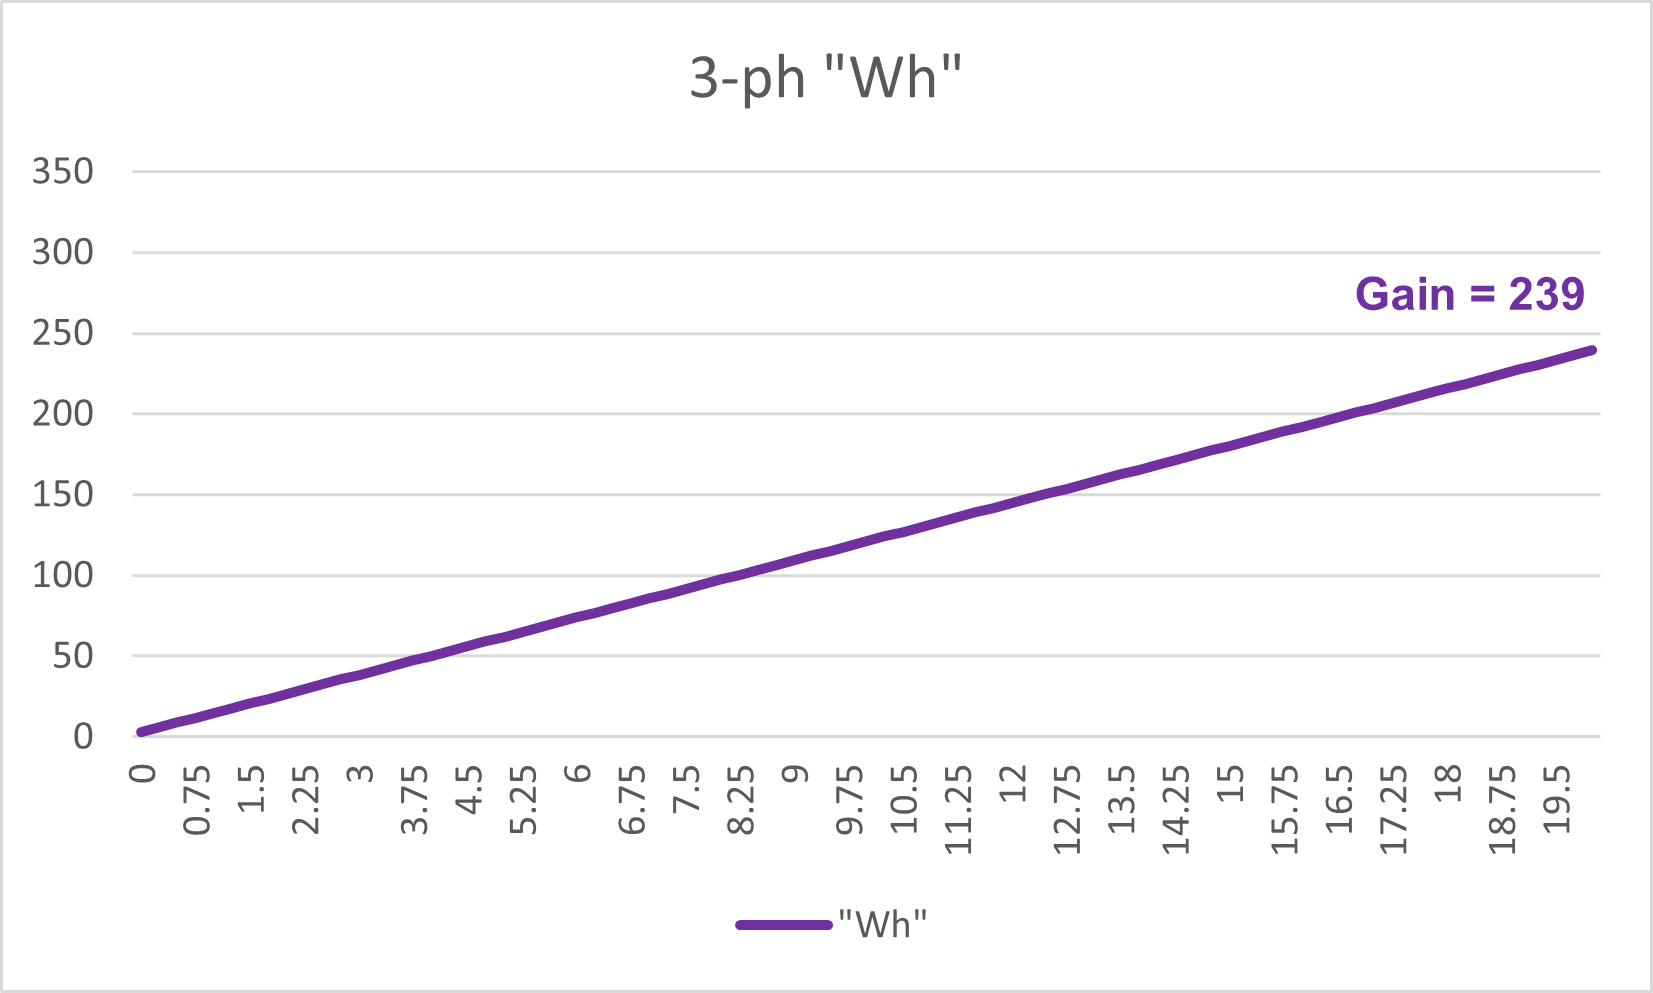 Figure 12: Three-phase system: Cumulative Power Transfer Figure 12: Three-phase system: Cumulative Power Transfer
Four-phaseJust for fun, lets then add a fourth phase D. the four phases are now separated by 90°. We can now see that at any instant, the A and C phases are 180° opposite, whilst the B and D phases are also 180° opposite. 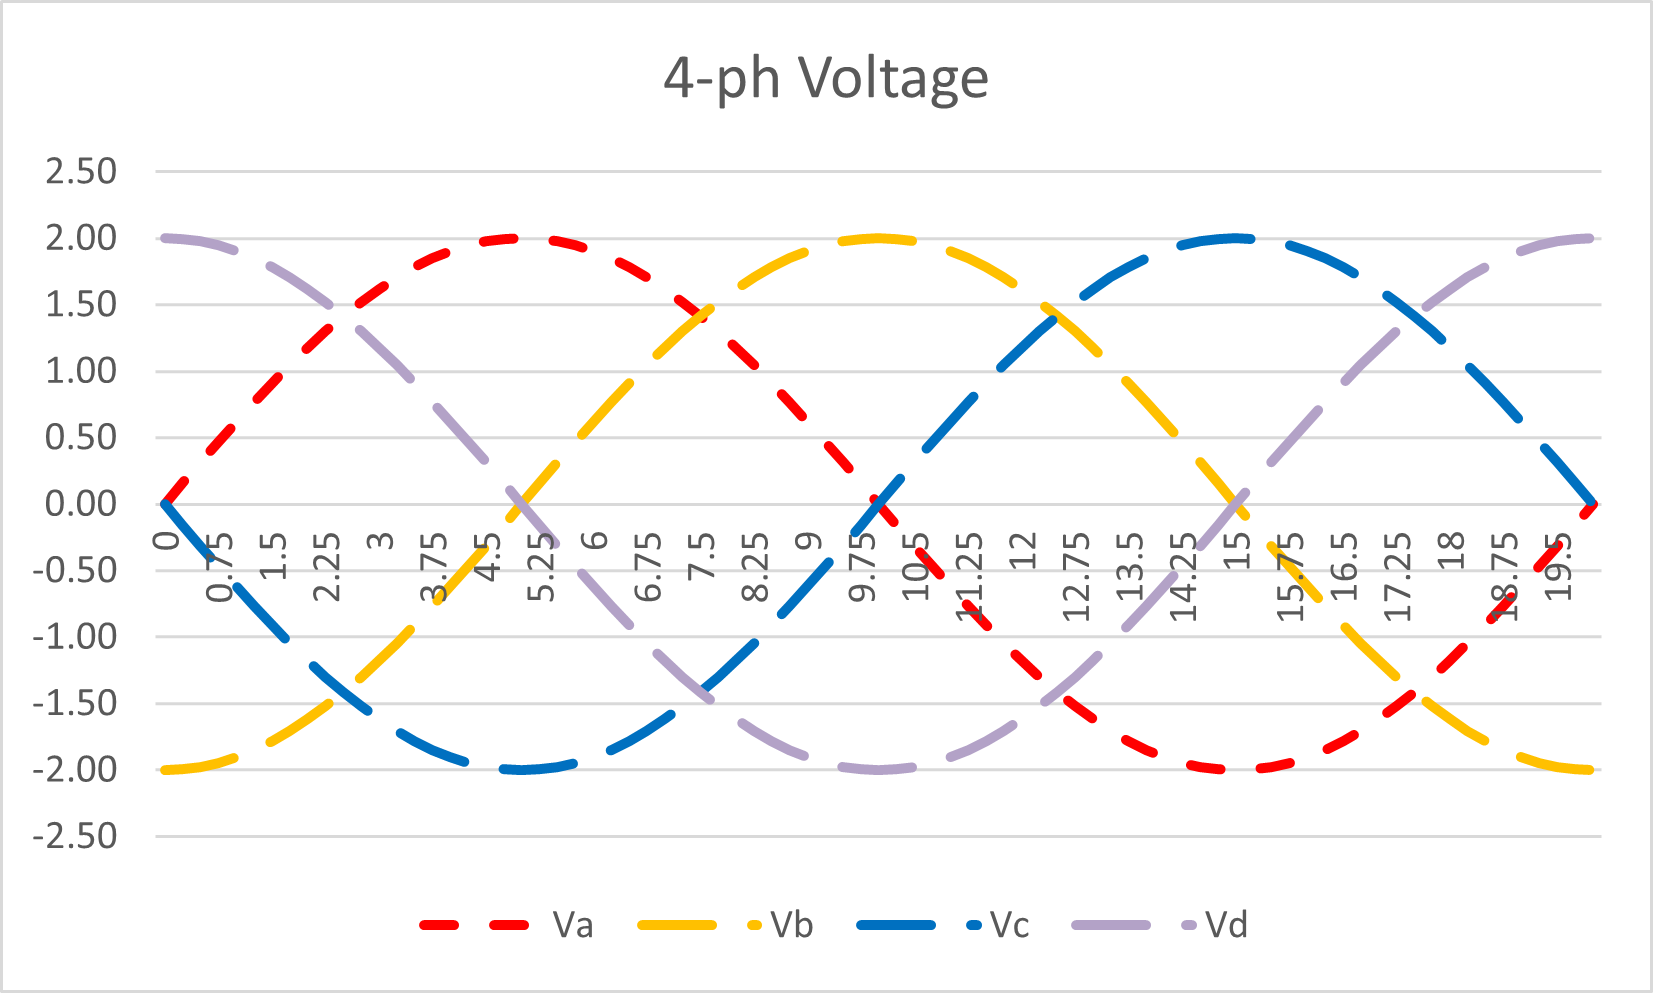 Figure 13: Four-phase system: Alternating Voltage Waveform Figure 13: Four-phase system: Alternating Voltage Waveform
Again lets make the B, C and D phase currents lag by 13°, 16° and 19° for clarity. 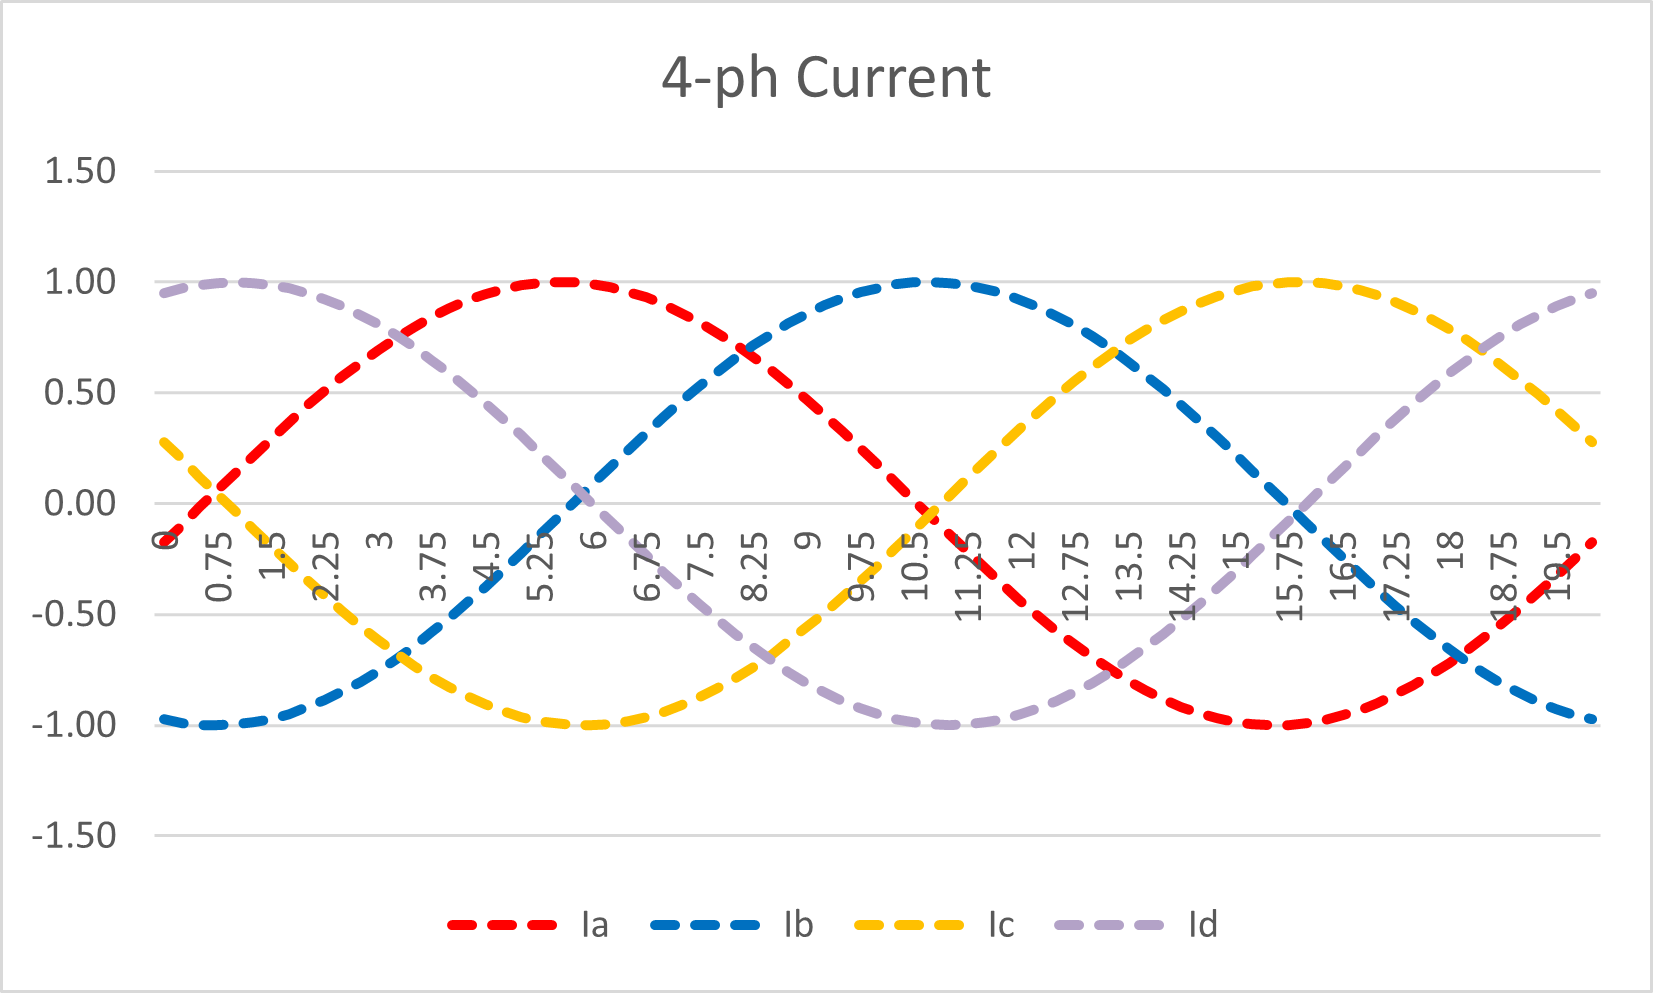 Figure 14: Four-phase system: Alternating Current Waveform Figure 14: Four-phase system: Alternating Current Waveform
And now we have the four individual powers which add up to a “flat” line (the slight alternating value is because I have put a slightly different phase angle on the four phases for clarity) 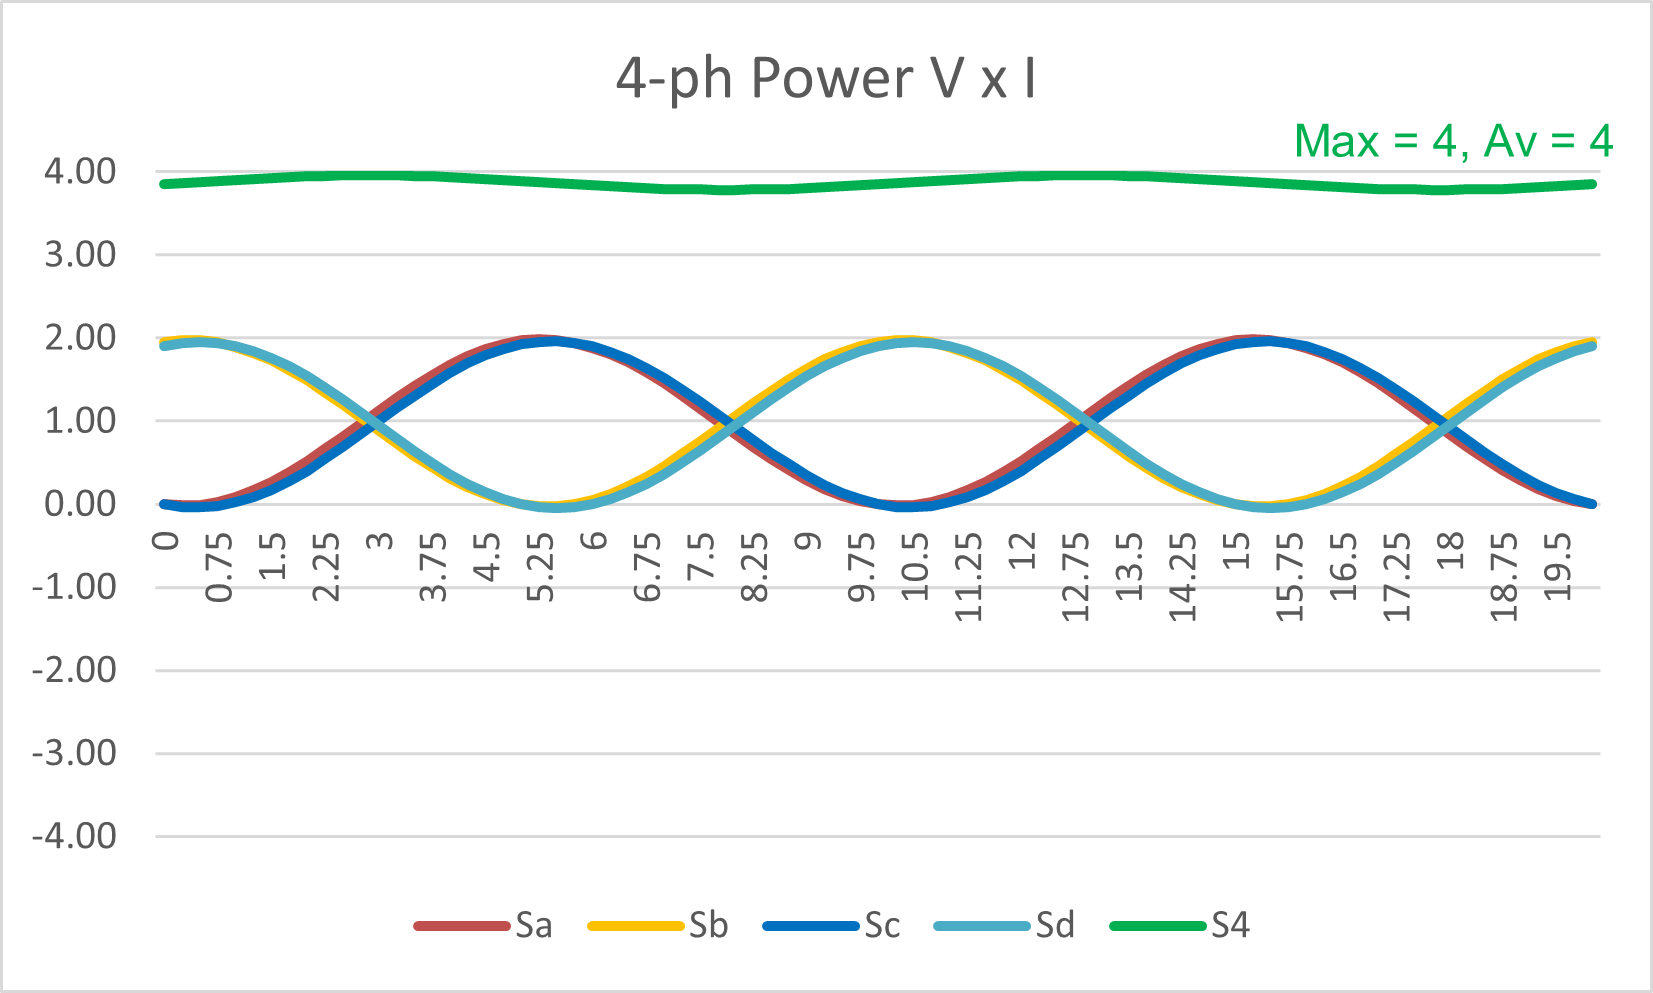 Figure 15: Four-phase system: Apparent Power Waveform Figure 15: Four-phase system: Apparent Power Waveform
Yes the total is now a value of “4” and an average of “4”, but we have had to add a whole extra phase of infrastructure and equipment. The “economics” of increasing from a power transfer of “3” to a transfer of “4” is at least “proportional”. We can similarly see a 5-phase system would also be proportional 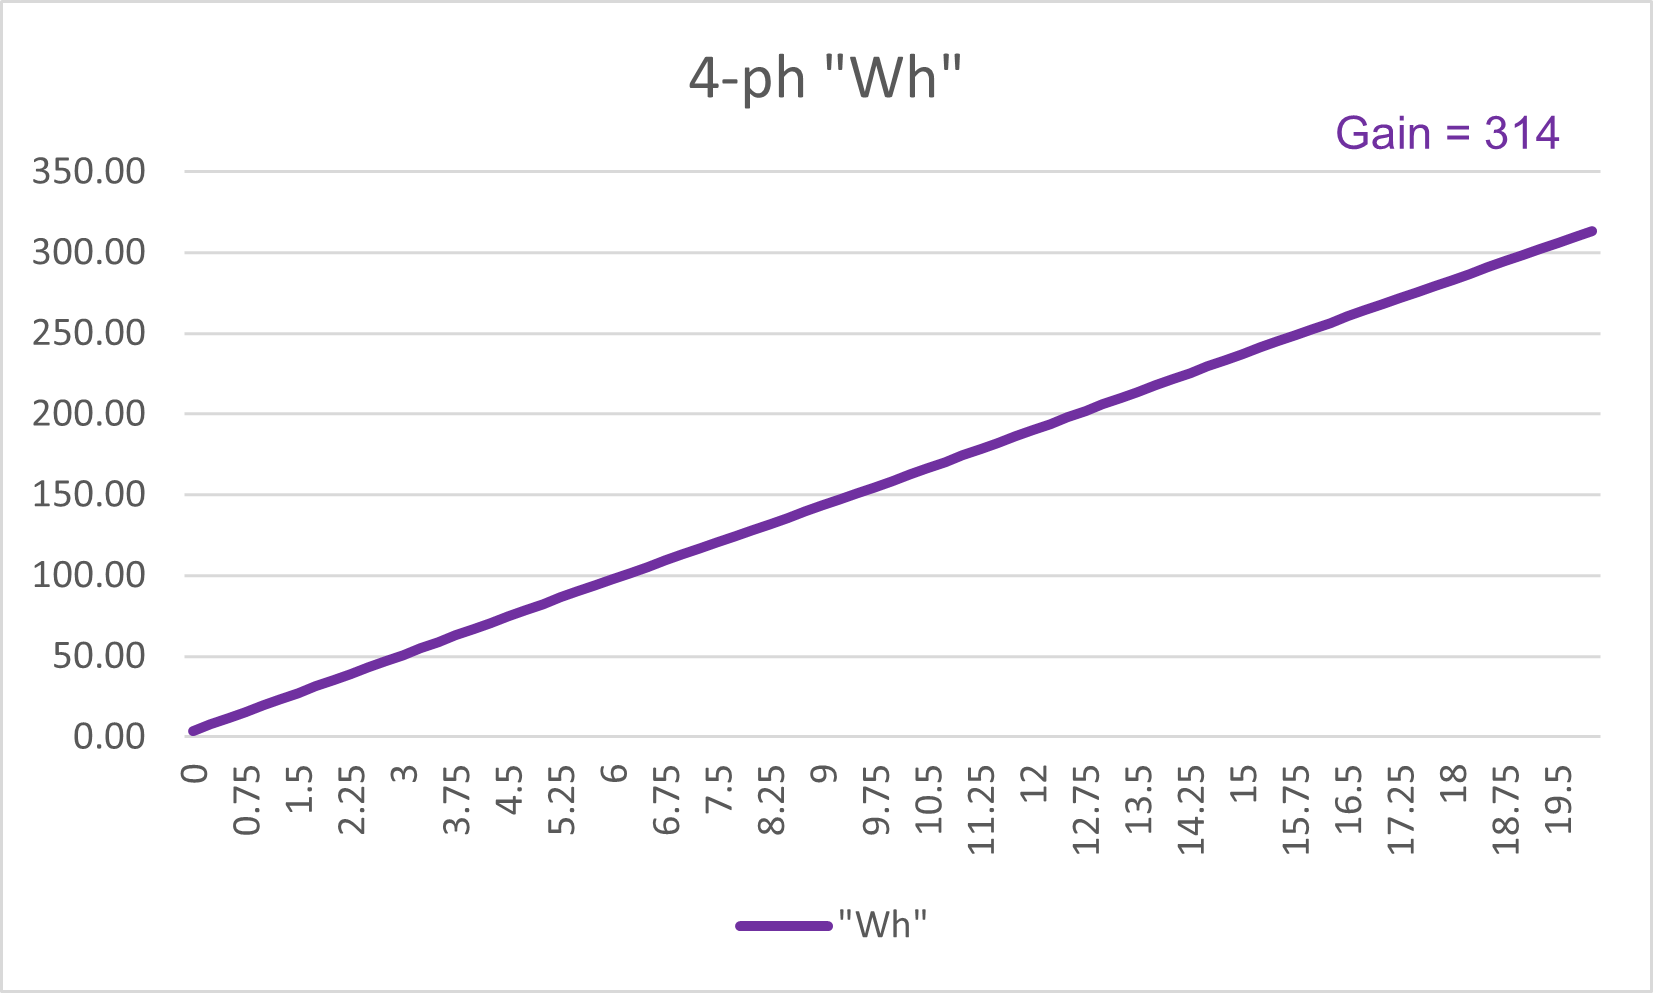 Figure 16: Four-phase system: Cumulative Power Transfer Figure 16: Four-phase system: Cumulative Power Transfer
Five phaseWe could continue to play with Excel to show a 5-phase system, but I hope you can guess it is also “proportional as a constant transfer of “5”. It will also show a straight line increase of energy transfer. Six PhaseYou may have heard of various plans for 6-phase systems. Logically the total power transfer is still “proportional” as a value of “6”. Obviously that means six conductors to get the total of “6” power transfer. But I can equally get “6” units of power transfer from two sets of 3-phase systems. If we build a tower with three cross arms it can support two sets of 3‑phase conductors, or 1 set of 6‑phase .. it is the same construction. True. This now gets into the subtleties of the mechanical and civil infrastructure build and perhaps even some other electrical factors which are not the subject or depth of this analysis.
Ending the hypothetical debate: 2 or 3 phase!2-phase is not constant power transfer. 3-phase (and more) is! So if you hear of any discussions about optimisation of the power system to just 2-phases, or some expansion to 4-phases, please feel free to send them the link to this page: https://ideology.atlassian.net/l/cp/XDW5hb76
|