Most power engineers would agree that the concepts of MW vs MWh is quite straight forward. However when it comes to metering, there is avast difference between Instantaneous MW and MW Demand! Also depending on your Demand Interval, the same loading can produce two very different bills! Suppose your billing period is once a month. Also suppose your entire energy usage occurred in a 50 minute period on one day as follows: 1.4 MW for 20 minutes (0.33 hrs), switched that off then
0.8 MW for 15 minutes (0.25 hrs) then switched that off then
1.65 MW for 10 minutes (0.165 hrs) and the switched that off and then
8.6 MW for 5 minutes (0.125 hrs) So just looking at the instantaneous MW and total MWh the chart is as follows (click image to enlarge): 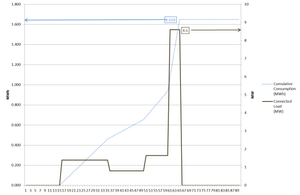
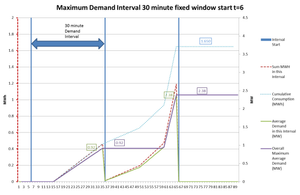
Clearly the peak load connected was 8.6 MW and overall you consumed 1.65 MWh Now depending on what type of metering arrangement you have with the utility, or if you have three different meters configured differently, you would get these different results on your bill at the end of the month. a) 30 minute fixed Demand Interval: 1.65 MWh and 2.38 MW Maximum Demand
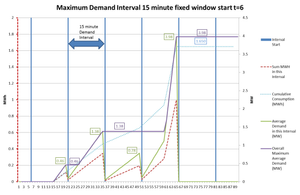
 b) 15 minute fixed Demand Interval: 1.65 MWh and 3.98 MW Maximum Demand
 c) 15 minute sliding window Demand Interval: 1.65 MWh and 3.98 MW Maximum Demand
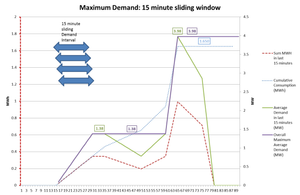
Note the sliding window doesn't have the same saw-tooth restart at the end of each billing period but obviously has the same average demand calculation every 15 minutes when the period coincides with the fixed window and so has the same Maximum Demand on the bill. |